中国境内的许多CDN服务商等都开始强烈要求备案才可使用服务,而导致很多个人型的网站没有防御,从而很容易被攻击。
接下来的教程仅适用于拥有对自己服务器完全控制权的人使用[copy from GitHub]
naxsi setup
Jump to bottomAnnihil edited this page on Mar 20, 2017 · 4 revisions
Basic Setup
Architecture of naxsi configuration
- http {} level :
include naxsi_core.rules - server {} level :
- location {} level :
- location /RequestDenied
- return HTTP error code, post-processing …
Example configuration
#Only for nginx's version with modular support
load_module /../modules/ngx_http_naxsi_module.so;
events {
 ...
}
http {
 include /tmp/naxsi_ut/naxsi_core.rules;
 ...
 server {
  listen ...;
  server_name  ...;
  location / {
   #Enable naxsi
   SecRulesEnabled;
   #Enable learning mode
   LearningMode;
   #Define where blocked requests go
   DeniedUrl "/50x.html";
   #CheckRules, determining when naxsi needs to take action
   CheckRule "$SQL >= 8" BLOCK;
   CheckRule "$RFI >= 8" BLOCK;
   CheckRule "$TRAVERSAL >= 4" BLOCK;
   CheckRule "$EVADE >= 4" BLOCK;
   CheckRule "$XSS >= 8" BLOCK;
   #naxsi logs goes there
   error_log /.../foo.log;
   ...
  }
  error_page   500 502 503 504  /50x.html;
  #This is where the blocked requests are going
  location = /50x.html {
  return 418; #I'm a teapot \o/
  }
 }
}
Code language: PHP (php)
Next steps
The next step is learning; however, before jumping there, ensure that you have:
- A nginx as a webserver or reverse proxy
- Naxsi installed and running in learning mode
- If you perform a request such as
curl 'http://127.0.0.1:4242/?a=<>', you should see a NAXSI_FMT in your logs :2016/07/12 13:27:04 [error] 14492#0: *1 NAXSI_FMT: ip=127.0.0.1&server=127.0.0.1&uri=/&learning=1&vers=0.55rc2&total_processed=1&total_blocked=1&block=1&cscore0=$XSS&score0=16&zone0=ARGS&id0=1302&var_name0=a&zone1=ARGS&id1=1303&var_name1=a, client: 127.0.0.1, server: localhost, request: "GET /?a=<> HTTP/1.1", host: "127.0.0.1:4242"
Learning, log-injection, ElasticSearch, Kibana
The ElasticSearch/Kibana part is optional but provides a great comfort and way to visualize “what’s going on”.
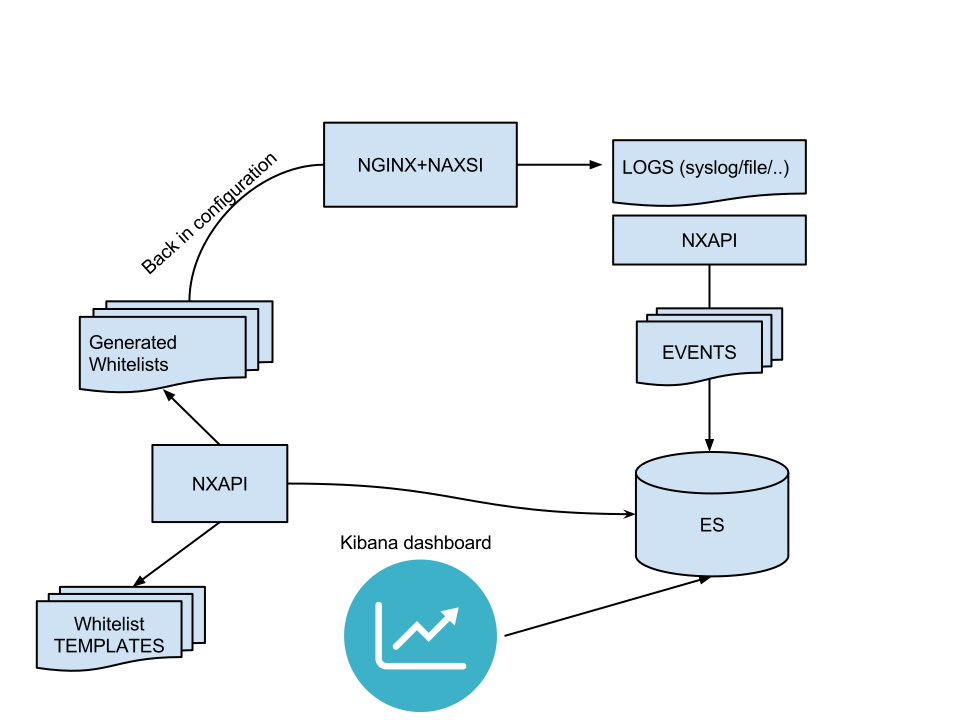
Components
Nxtool setup can be found here: (tl;dr: python setup.py install, or ./nxtool.py -c nxapi.json -x)
Kibana (v4 as of this writing) can be downloaded here:
Once those two components are setup, you should be able to inject naxsi logs into ElasticSearch with NxTool. Here is an example of what it might look like in production:
Configuration – NXTOOL
As stated in dedicated documentation, nxtool comes with a json file specifying ES location, index etc.
"elastic" : {
 "host" : "127.0.0.1:9200",
 "index" : "nxapi",
 "doctype" : "events",
 "default_ttl" : "7200",
 "max_size" : "1000",
 "version" : "2"
},
Code language: JavaScript (javascript)
Once configured and running on the same host as nginx, you can start injecting logs into ES:
nxtool.py --fifo /tmp/naxsi_pipe --no-timeout (here, nginx is being told to write logs to /tmp/naxsi_pipe which is a FIFO created by nxtool)
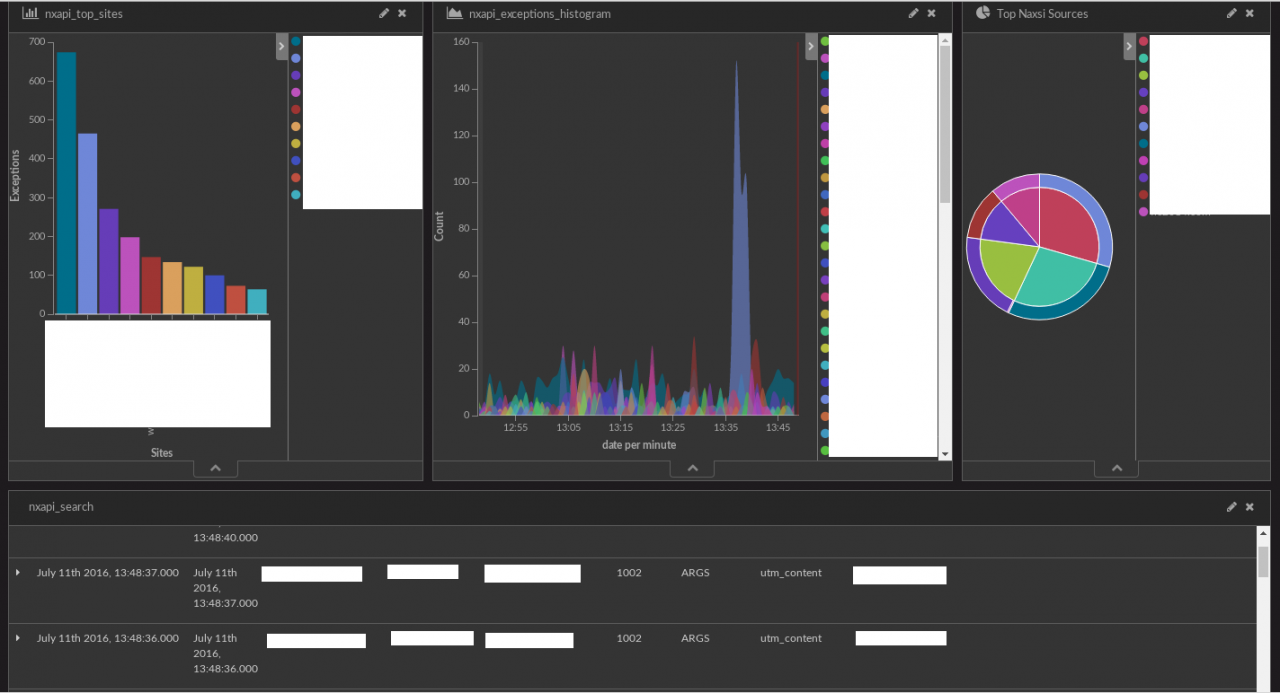
Configuration – Kibana
Now, you should be able to configure Kibana to setup a dashboard to visualize your naxsi data.
This step is left as an exercise for the reader, see Creating Kibana Dashboard.
GitHub Readme:https://github.com/nbs-system/naxsi/blob/master/README.md
了解 Starx's Home 的更多信息
订阅后即可通过电子邮件收到最新文章。
0 条评论